How many staff you need each day, planned from your own volume history
You need enough people on each day to handle the work that day will bring: forecast volume times handling time, divided by the productive hours per person. 4castPlannr forecasts daily volume per channel or location from your history, then picks shift patterns that cover the expected workload at the lowest total cost of labor and unhandled work.
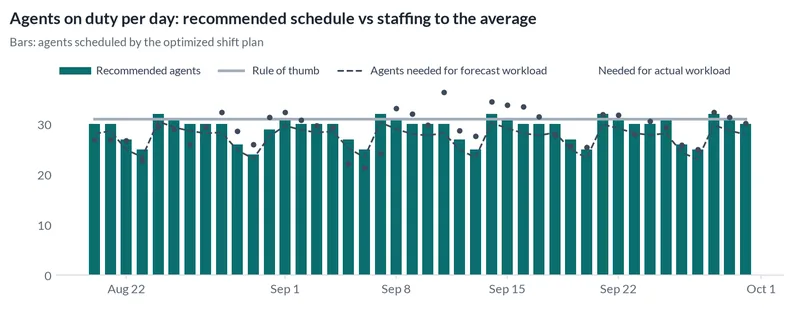
The decision you make every week
Every week or month you build a schedule. Staff to the average and you are short on busy days and idle on quiet ones. Add a big buffer and labor cost climbs. Multi-location businesses do this separately for every site.
Ask it in your own words
- How many agents do we need each day for the next 6 weeks for phone, web and chat?
- Forecast weekly appointments per clinic and tell me how many staff to schedule.
- We run 5-day shifts. Which shift patterns should we hire for next month?
What to send
- Daily or hourly volume per channel, queue or location: a CSV or Excel export from your phone system, booking tool or POS.
- Optional: handling time per contact, shift patterns, wage cost, and the cost of work left undone.
- How you schedule today (for example: average daily volume plus 10%).
What you get back
- A daily forecast per channel or location, with a range.
- A shift plan: how many people on each shift pattern, and the staff on duty each day.
- Labor cost and expected uncovered workload for the plan and for your current rule.
- Accuracy measured on your own history.
Tried on public data
Each example below ran end to end on a public dataset. Real numbers, including results that were not in our favor.
| Case study | Data | Typical error | Better than repeating last season | Plan result on held-back data |
|---|---|---|---|---|
| Contact center staffing plan | San Francisco, United States | 9.8% | 27% | Saved $9,091 (2.1%) |
| Hotel room-nights | Portugal | 29.6% | 37% | Forecast only |
| Airport passengers by airline | San Francisco, United States | 11.8% | 38% | Forecast only |
| Bike rentals with weather | Washington, DC, United States | 28.6% | 54% | Forecast only |
| Messy monthly airline file | San Francisco, United States | 12.1% | 36% | Forecast only |
| Messy daily rentals file | Washington, DC, United States | 27.4% | 14% | Forecast only |
Plan costs in the case studies are example values. Typical error is the share of actual volume the forecast missed by, measured on past data the model had not seen.
What we do with your data
Volume is forecast with whichever tested method did best on your history. The plan is an optimization model over the shift patterns you can actually use, balancing labor cost against the expected cost of work left unhandled across many demand scenarios. Today it plans daily workload. Answer-time targets within the day need interval-level data, which is on our roadmap.
Case studies
-
Contact center staffing plan
San Francisco 311 public data: daily phone, web and app requests forecast six weeks ahead, and an agent shift plan replayed on the weeks that followed.
San Francisco, United States · 9.8% error · 27% better than repeating last season
-
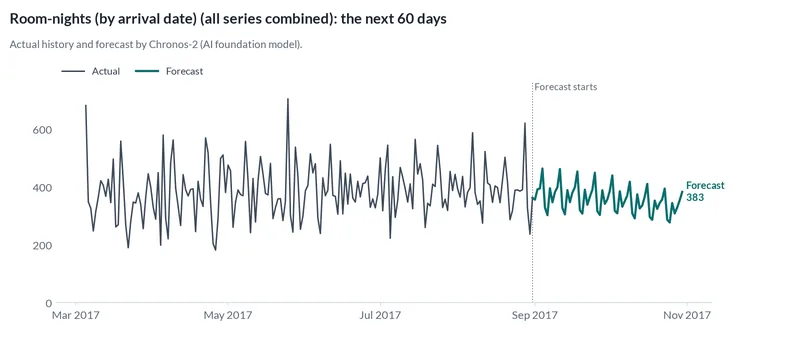
Hotel room-nights
A public dataset from two hotels: daily room-nights forecast 60 days ahead per hotel, with the accuracy we measured in testing.
Portugal · 29.6% error · 37% better than repeating last season
-
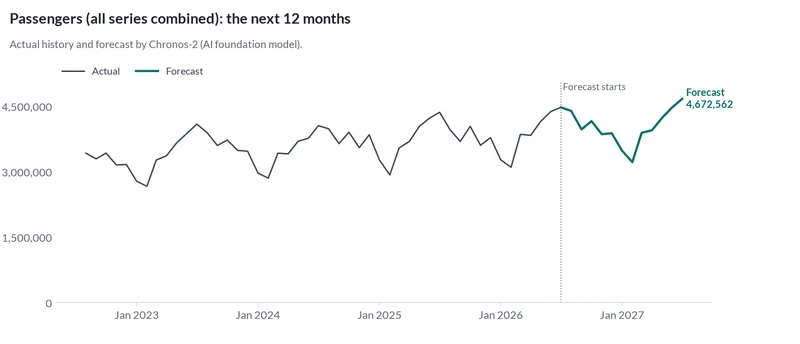
Airport passengers by airline
San Francisco International Airport's public statistics: monthly passengers for the 10 largest airlines forecast a year ahead.
San Francisco, United States · 11.8% error · 38% better than repeating last season
-
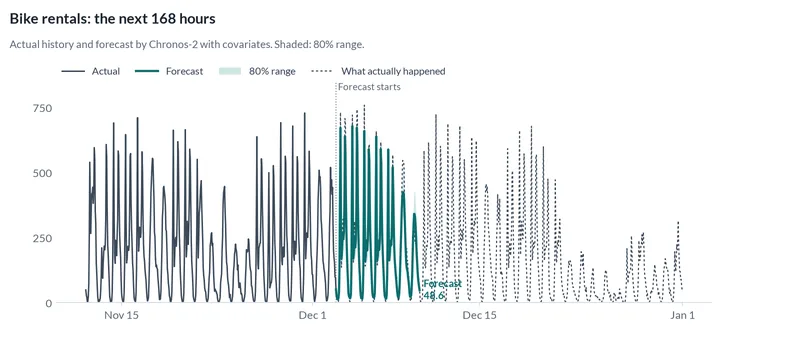
Bike rentals with weather
Capital Bikeshare data from the UCI repository: hourly rentals forecast a week ahead, with and without weather as an extra input.
Washington, DC, United States · 28.6% error · 54% better than repeating last season
-
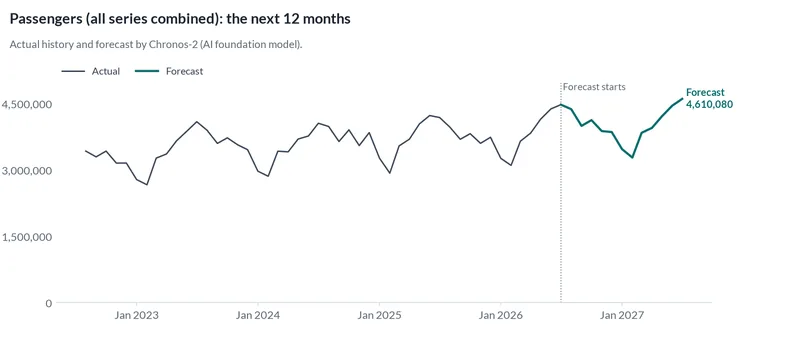
Messy monthly airline file
The SFO passenger data deliberately broken: months written three ways, missing and duplicated rows, negative corrections. Same engine, no hand cleaning.
San Francisco, United States · 12.1% error · 36% better than repeating last season · messy file test
-
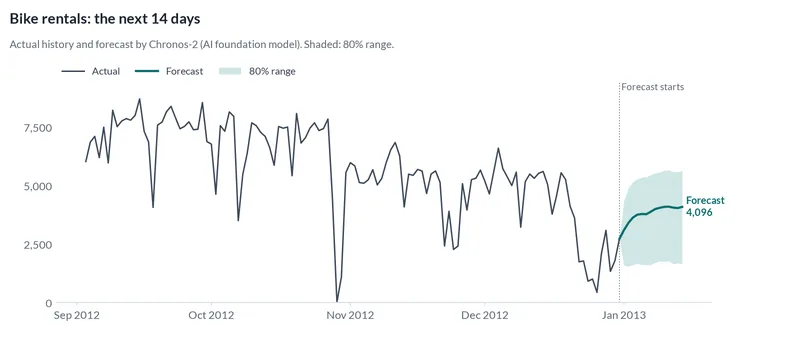
Messy daily rentals file
The bike sharing data deliberately broken: tabs, two date styles, missing days, duplicates, 'N/A' temperatures and thousands separators. Same engine, no hand cleaning.
Washington, DC, United States · 27.4% error · 14% better than repeating last season · messy file test
Questions
Is this a call center staffing calculator?
A staffing calculator turns a volume number into a headcount. We also produce the volume number, measure how accurate it is, and choose real shift patterns. We do not yet model answer times within the day (Erlang C); that needs interval-level data and is on our roadmap.
Does it work for multi-location service businesses?
Yes. Each location or channel gets its own forecast, and the plan is built per location from the same export.
How far ahead can you plan?
Usually 2 to 8 weeks for daily staffing. We test the forecast at the same distance ahead you plan for, so the accuracy we report matches how you use it.
What if my volume has a big seasonal swing?
Seasonality is learned from your history. With at least a year of data we can capture yearly patterns; with less, we capture weekly patterns and say so.
Try it on your own data
Upload your export and describe the decision. Your first forecast is free for the first 50 businesses.
Related use cases
- Restaurant demand for restaurants and food service
Forecast covers, orders or items per day and know how much to prep and order.
- Inventory reorder for wholesale distributors
Know how much to reorder of every item, every week, from the sales export you already have.