How much inventory to reorder, worked out for you every week
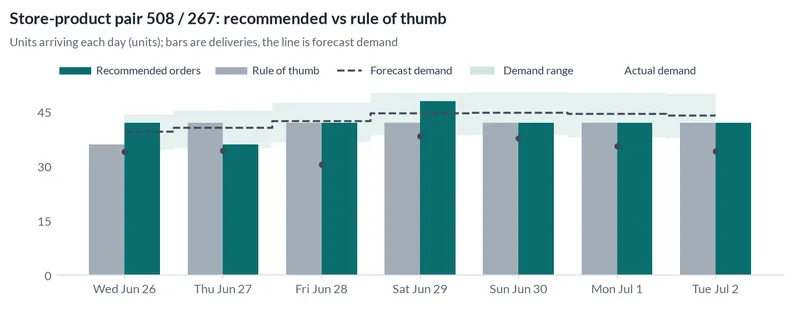
The right reorder amount is what you expect to sell before the next delivery arrives, plus a buffer sized to how wrong that forecast tends to be, rounded to your case or pallet size. 4castPlannr works this out for every item from your sales export: it forecasts demand, measures its own error, and returns a reorder list you can send to suppliers.
The decision you make every week
Every week someone looks at last month's sales, checks what is on the shelf, and guesses how much to order from each supplier. Order too little and you run out of your best sellers. Order too much and cash sits in the warehouse, or product expires.
Ask it in your own words
- How much of each item should I order this week so I don't run out?
- We order from our main supplier every Tuesday. Tell me what to put on the order.
- Forecast weekly cases for our top 300 items and flag anything that's about to run short.
What to send
- A sales or invoice export from QuickBooks, your ERP or a spreadsheet: date, item, quantity. One row per sale or per day is fine.
- Optional: what you have on hand, lead times, case sizes, minimum orders and delivery days.
- Your current rule, in your words (for example: order two weeks of average sales).
What you get back
- A forecast per item for the coming weeks, with a range, not just one number.
- A reorder list in whole cases, timed to your delivery days.
- The accuracy we measured on your own history, compared with simple rules like repeating last week.
- A comparison with your current rule, so you can see what changes and why.
Tried on public data
Each example below ran end to end on a public dataset. Real numbers, including results that were not in our favor.
| Case study | Data | Typical error | Better than repeating last season | Plan result on held-back data |
|---|---|---|---|---|
| Fresh food reorder plan | China | 13% | 13% | Saved $102 (0.2%) |
| Wholesale orders for 500 store-product pairs | Iowa, United States | 64.6% | 25% | Flagged for review |
| Online store revenue | United Kingdom | 31.4% | 20% | Forecast only |
Plan costs in the case studies are example values. Typical error is the share of actual volume the forecast missed by, measured on past data the model had not seen.
What we do with your data
We test several forecasting methods on your past data, from simple rules to an AI forecasting model, and keep the one that would have done best. The reorder list comes from an optimization model that weighs the cost of running out against the cost of holding and wasting stock, within your pack sizes, minimum orders and delivery days.
Case studies
-
Fresh food reorder plan
Public fresh-retail data: 7-day demand forecasts for the 100 busiest store-product pairs and a reorder plan in whole cases, replayed on the following week.
China · 13% error · 13% better than repeating last season
-
Wholesale orders for 500 store-product pairs
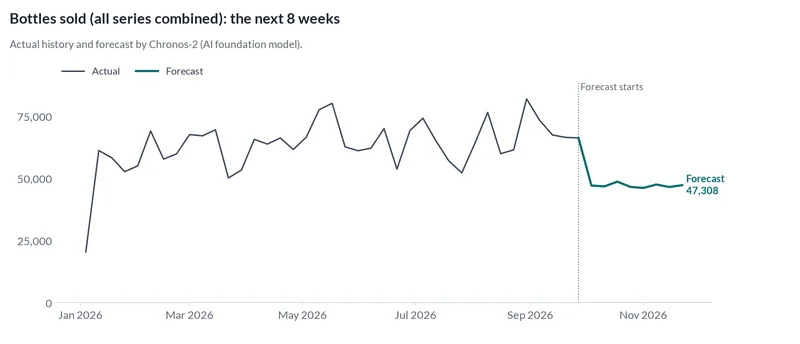
Iowa's public liquor sales: 8-week forecasts for the 500 biggest store-product pairs. Many items sell in bursts, so the result was flagged for review.
Iowa, United States · 64.6% error · 25% better than repeating last season
-
Online store revenue
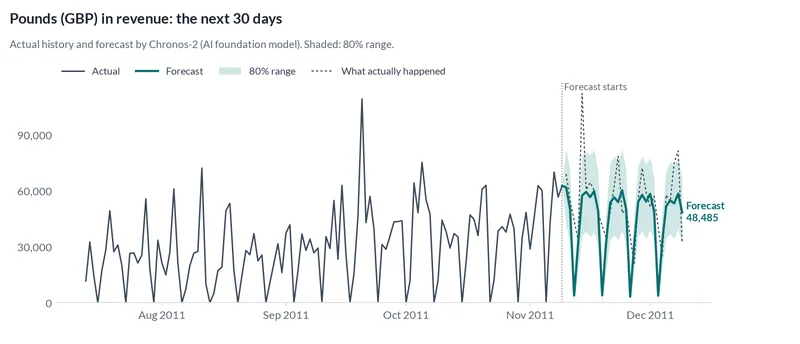
A public UK online retailer's order lines turned into a 30-day daily revenue forecast for the Christmas peak, checked against what actually happened.
United Kingdom · 31.4% error · 20% better than repeating last season
Questions
How do I calculate how much inventory to reorder?
Forecast demand until the next delivery after this one arrives, add safety stock for forecast error, subtract what you have on hand and on order, then round up to your pack size. The hard parts are the forecast and the buffer. 4castPlannr measures both on your own history instead of using a fixed percentage.
Do I need QuickBooks or an ERP?
No. Any CSV or Excel export with dates, items and quantities works. QuickBooks and most ERPs can export a sales by item report to Excel, which is enough to start.
What about items that sell only now and then?
Items with many zero weeks are hard for any method. We use methods built for sporadic demand, tell you which items fall into that group, and flag the result for review when accuracy is low, as in our Iowa wholesale example.
Is this a reorder point calculator?
It does what a reorder point calculator does, but per item and per week, with the buffer set from measured forecast error instead of a guess, and with your case sizes and delivery days built in.
Try it on your own data
Upload your export and describe the decision. Your first forecast is free for the first 50 businesses.
Related use cases
- Production planning for food and beverage producers
Plan what to make each day on a shared line, with shelf life, changeovers and capacity built in.
- Restaurant demand for restaurants and food service
Forecast covers, orders or items per day and know how much to prep and order.