How 4castPlannr works
You upload a spreadsheet and describe the decision in one or two sentences. 4castPlannr reads the file, works out what to forecast, tests several forecasting methods on your own history, keeps the most accurate one, and, when your question is a decision, builds a plan around your costs and limits. You get a plain-English report, charts and a spreadsheet.
-
Describe the decision in your own words
Tell us what you decide each week, the way you would tell a new hire.
Write what you want to predict or decide, for example: how many cases of each item should we order every Tuesday. No templates, no settings, no statistics vocabulary. If something is unclear, we ask a short question instead of guessing.
-
Upload the export you already have
A CSV or Excel export from QuickBooks, your POS, ERP or a spreadsheet.
Any CSV or Excel export with dates and the numbers you care about works: sales by item, orders, calls per day, meter readings. Messy files are fine. Mixed date formats, duplicate rows, refunds and gaps are cleaned automatically, and every change is listed in your report.
-
We test several methods on your own history
We hide your recent past, forecast it, and keep whatever did best.
We hide the most recent stretch of your data, forecast it as if it were the future, and compare with what really happened. We repeat this several times with simple rules (like repeating last week), classic statistics and an AI forecasting model, and keep the method with the least error. If nothing beats the simple rule, we tell you.
-
We turn the forecast into a plan
How much to order, make or staff, within your real limits.
When your question is a decision, we build an optimization model of it: what running short costs you, what holding or wasting costs, your pack sizes, delivery days, capacity or shift patterns. It finds the plan with the lowest expected total cost across many possible futures, and compares it with your current rule of thumb.
-
You get a report you can act on
Plain-English summary, charts, and a spreadsheet with the numbers.
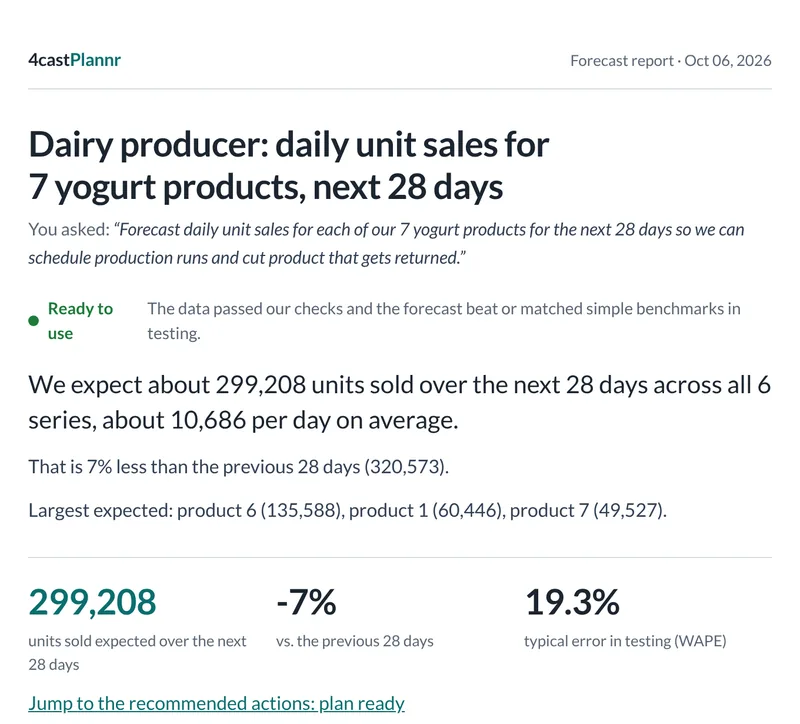
The report starts with the answer, then shows the forecast with its range, the accuracy we measured, the plan and how it compares with what you do today. Anything we had to assume is listed. The spreadsheet has the forecast and the plan line by line.
-
Then we keep sending the answer
Send a fresh export each week or month and get the updated plan back.
Forecasts go stale, so the work repeats. During the launch period you send a fresh export and we send back the updated forecast and plan, with accuracy tracked over time. Direct connections to tools like QuickBooks and Google Sheets are planned but not available yet.
What we do not do
- We do not ask you to pick a model, tune settings or learn new vocabulary.
- We do not hide bad news. If a simple rule beats our forecast on your data, the report says so.
- No language model makes up numbers. Our software reads your request and file to propose what to forecast, you confirm it, and the numbers come from tested forecasting methods and an optimization model, and can be reproduced.
- We do not use your data to train models for anyone else.
Want the details? Read the methodology, or see every number on the results page.
Start with one decision
Upload one export and ask one question. Your first forecast is free for the first 50 businesses.