Weekly wholesale demand forecast for 500 store-product pairs (flagged for review)
We forecast weekly bottles sold for each of 497 store-product pairs 8 weeks ahead from a public dataset. In testing on past data, the selected method (the AI forecasting model) was off by 64.6% of actual volume on average, 25% less error than repeating last week. The result was flagged for review, and we explain why.
The request
"Forecast weekly bottle sales for each of our top 500 store-and-product combinations for the next 8 weeks so we can set orders and allocate stock to stores."
The forecast
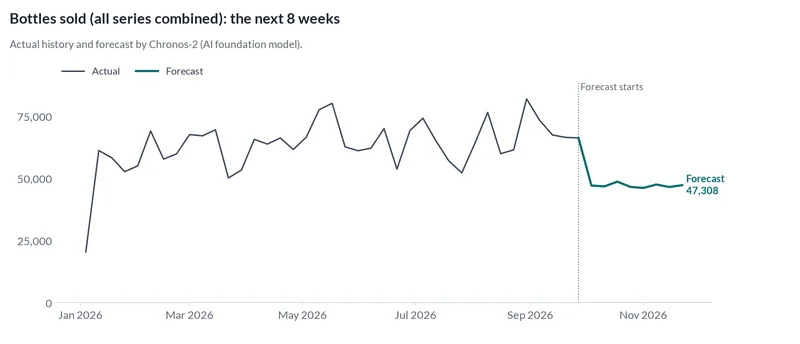
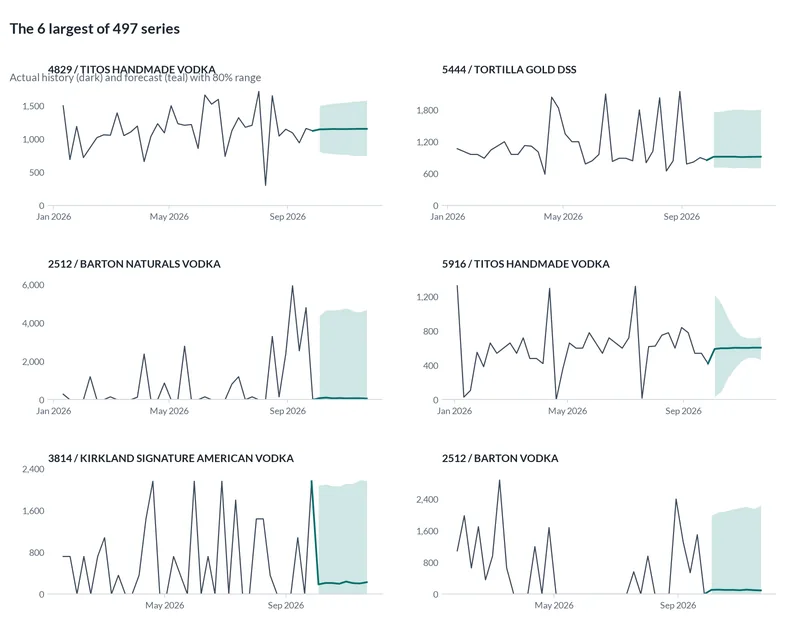
We expect about 377,021 bottles sold over the next 8 weeks across all 497 series, about 47,128 per week on average.
How accurate was it?
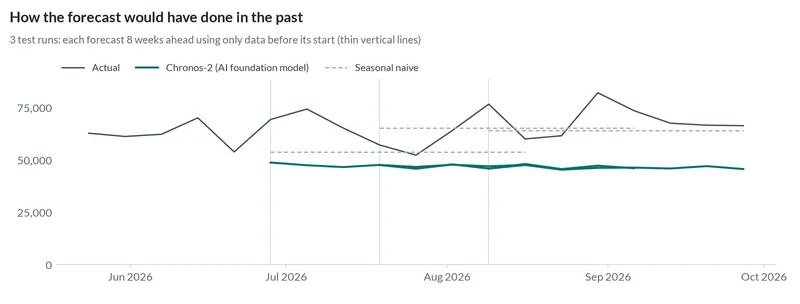
We hid the most recent stretch of history, forecast it using only what came before, and compared with what really happened. We did that 3 times, each time 8 weeks ahead, for every method below. The typical error is the share of actual volume the forecast missed by, added up across all 497 store-product pairs.
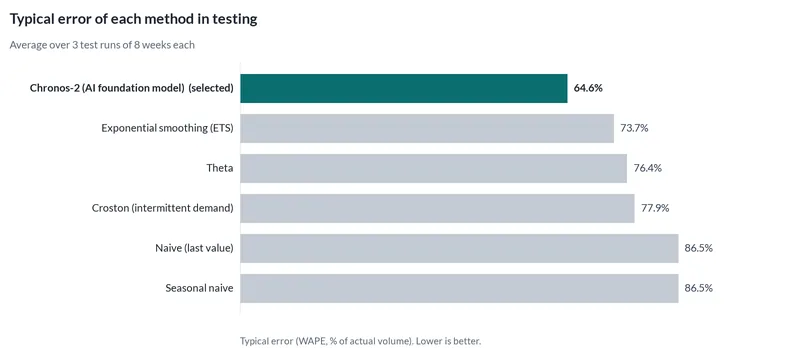
The selected method, an AI forecasting model that was not trained on this data, was off by 64.6% on average, against 86.5% for simply repeating last week.
| Method | Kind | Typical error | Actual inside 80% range |
|---|---|---|---|
| AI forecasting model Selected | AI | 64.6% | 84% |
| Exponential smoothing | Classic | 73.7% | 83% |
| Croston method | Classic | 77.9% | n/a |
| Theta method | Classic | 76.4% | 81% |
| Repeat the last value | Simple rule | 86.5% | 95% |
| Repeat last season | Simple rule | 86.5% | 95% |
Why this result was flagged for review
We flag a result for review instead of sending it when the data or the accuracy suggests a person should look first. With a customer, this is where we would ask questions.
- 137 rows have a negative value (for example returns or refunds). They were netted against the other rows in the same period.
- Skipped 3 series with no recent data: 010752 / SVEDKA 80PRF, 2633 / MONTEZUMA GOLD, 4312 / CROWN ROYAL.
- 167 weeks with no rows were filled by interpolation, because bottles sold is otherwise never close to zero (more likely missing data than a closed business). If you were closed on those weeks, tell us and we will treat them as zero.
- 6 weeks had a negative total after returns; set to zero.
- Less than two full seasonal cycles of history (31 weeks); seasonal patterns may be missed.
- The level of the data changed recently (010127 / FIREBALL CINNAMON WHISKEY: dropped to near zero after 2026-08-16; 010206 / FIREBALL CINNAMON WHISKEY: recent level is 0.5x the level before 2026-08-16; 010221 / FIREBALL CINNAMON WHISKEY: recent level is 0.5x the level before 2026-08-16; and 49 more series). Older history may be less relevant.
- The history is short, so the forecast was tested on less past data than we would like. Treat the accuracy figures as rough.
Technical details
- Data
- Iowa Liquor Sales (Iowa Data Hub, Dept. of Revenue, Alcohol Operations Bureau). 497 store-product pairs, weekly, from 2026-01-04 to 2026-09-27.
- How we prepared the data
- Uses the 2026 year-to-date file (about 400 MB zip, January to September 2026) instead of all years. The engine keeps the 500 store-and-product pairs with the most bottles sold, as the customer asked. With under a year of weekly history there is no yearly seasonality to learn, so the seasonal period is 1 (seasonal naive = last week).
- Testing
- 3 rolling tests, each 8 weeks ahead. Selection metric: WAPE (weighted absolute percentage error, the "typical error" above). Also reported: MASE 0.80 for the selected method.
- Methods
- Chronos-2 (AI foundation model), Exponential smoothing (ETS), Croston (intermittent demand), Theta, Naive (last value), Seasonal naive.
- Reproduce
- The case folder, spec and outputs are in the 4castPlannr repository under
cases/iowa-liquor-sales/.
Data source and license
Iowa Liquor Sales, 2026. Iowa Department of Revenue, Alcohol Operations Bureau, via Iowa Data Hub (data.iowa.gov). Licensed CC BY 4.0. Modified (aggregated) by SolveAhead.
License: CC BY 4.0. Source: original data. The forecasts and charts on this page are derived from that data and carry the same attribution.
Have a decision like this?
This case is an example of inventory reorder for wholesale distributors. Send us your own export and question, and we will run the same tests on your data.
Related case studies
-
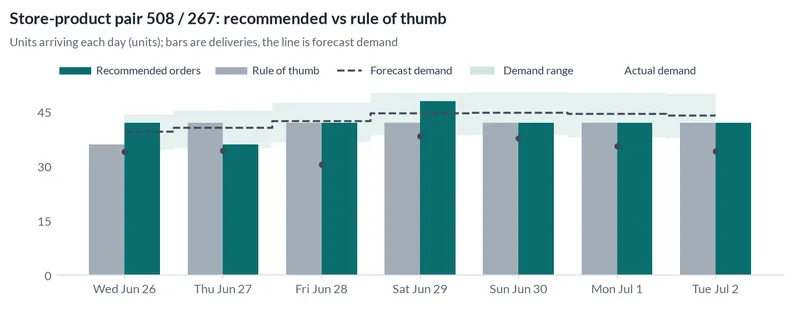
Fresh food reorder plan
Public fresh-retail data: 7-day demand forecasts for the 100 busiest store-product pairs and a reorder plan in whole cases, replayed on the following week.
China · 13% error · 13% better than repeating last season
-
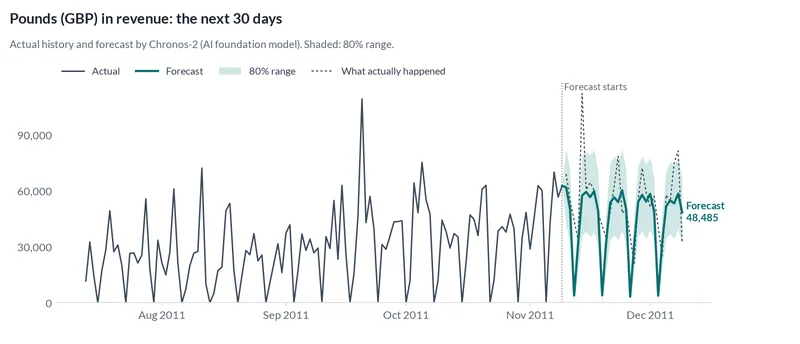
Online store revenue
A public UK online retailer's order lines turned into a 30-day daily revenue forecast for the Christmas peak, checked against what actually happened.
United Kingdom · 31.4% error · 20% better than repeating last season