Forecast daily revenue for the holiday peak from an order export
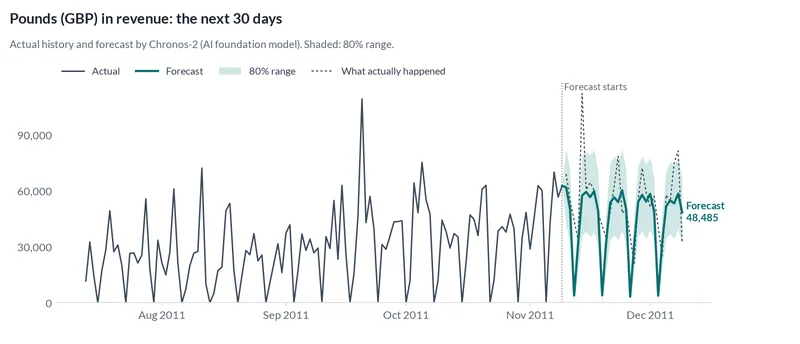
We forecast daily pounds (GBP) in revenue 30 days ahead from a public dataset. In testing on past data, the selected method (the AI forecasting model) was off by 31.4% of actual volume on average, 20% less error than repeating the same weekday last week.
The request
"Forecast our daily orders and revenue for the next 30 days, and weekly units for our top 200 products, so we can plan the Christmas peak."
The forecast
We expect about 1,351,265 pounds (GBP) in revenue over the next 30 days, about 45,042 per day on average.
How accurate was it?
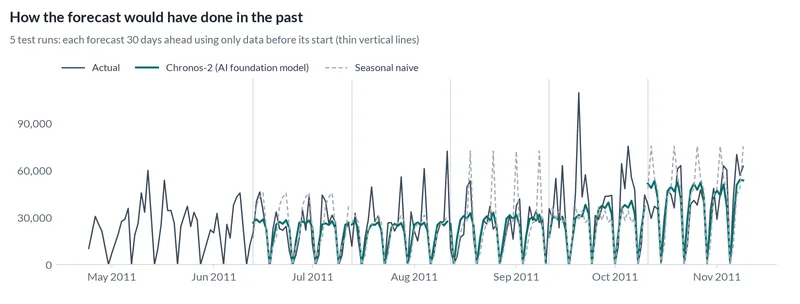
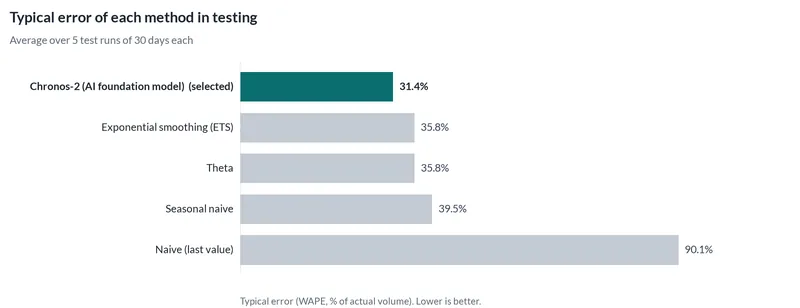
We hid the most recent stretch of history, forecast it using only what came before, and compared with what really happened. We did that 5 times, each time 30 days ahead, for every method below. The typical error is the share of actual volume the forecast missed by.
The selected method, an AI forecasting model that was not trained on this data, was off by 31.4% on average, against 39.5% for simply repeating the same weekday last week.
| Method | Kind | Typical error | Actual inside 80% range |
|---|---|---|---|
| AI forecasting model Selected | AI | 31.4% | 78% |
| Exponential smoothing | Classic | 35.8% | 85% |
| Theta method | Classic | 35.8% | 93% |
| Repeat last season | Simple rule | 39.5% | 91% |
| Repeat the last value | Simple rule | 90.1% | 95% |
Reality check on data no model saw
Before running anything, we set aside the final 26 days of the data (from 2011-11-09). Nothing in the testing above or the method choice could see them. Here is how every method did on that stretch.
The selected method was the most accurate here too, with 17.2% error.
| Method | Typical error |
|---|---|
| AI forecasting model Selected | 17.2% |
| Exponential smoothing | 19.7% |
| Theta method | 19.9% |
| Repeat last season | 21.9% |
| Repeat the last value | 26.6% |
What the engine noticed in the data
- Removed 22,523 rows that appeared in more than one sheet.
- Forecast made as of Nov 09, 2011: 88,067 later rows were hidden from the models and used afterwards to check the forecast.
- 18,102 rows have a negative value (for example returns or refunds). They were netted against the other rows in the same period.
- 31 days with no rows were filled by interpolation, because pounds (GBP) in revenue is otherwise never close to zero (more likely missing data than a closed business). If you were closed on those days, tell us and we will treat them as zero.
- 4 days had a negative total after returns; set to zero.
- In testing, the best model's errors were 31% of actual volume.
Technical details
- Data
- Online Retail II (UCI ML Repository #502), United Kingdom. 1 series, daily, from 2009-12-01 to 2011-11-09.
- How we prepared the data
- Daily revenue (Quantity x Price, cancellations netted). The data ends on Dec 9, 2011, so the forecast is made as of Nov 9, 2011 and then checked against the 30 days that really followed. The request also asks for orders and per-product units; v1 runs one target per job, so this case covers revenue.
- Testing
- 5 rolling tests, each 30 days ahead. Selection metric: WAPE (weighted absolute percentage error, the "typical error" above). Also reported: MASE 0.90 for the selected method.
- Methods
- Chronos-2 (AI foundation model), Exponential smoothing (ETS), Theta, Seasonal naive, Naive (last value).
- Reproduce
- The case folder, spec and outputs are in the 4castPlannr repository under
cases/online-retail-ii/.
Data source and license
Chen, D. (2012). Online Retail II [Dataset]. UCI Machine Learning Repository. https://doi.org/10.24432/C5CG6D. CC BY 4.0.
License: CC BY 4.0. Source: original data. The forecasts and charts on this page are derived from that data and carry the same attribution.
Have a decision like this?
This case is an example of inventory reorder for wholesale distributors. Send us your own export and question, and we will run the same tests on your data.
Related case studies
-
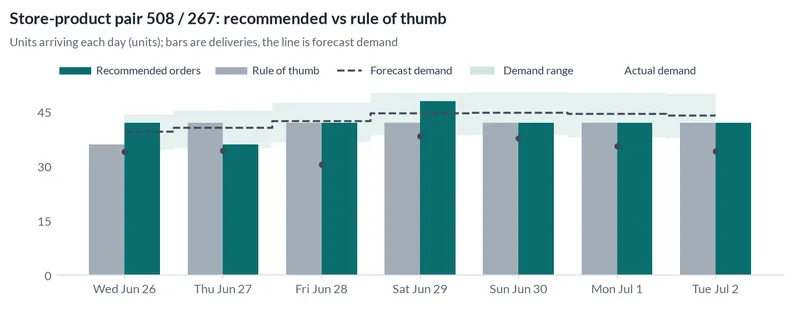
Fresh food reorder plan
Public fresh-retail data: 7-day demand forecasts for the 100 busiest store-product pairs and a reorder plan in whole cases, replayed on the following week.
China · 13% error · 13% better than repeating last season
-
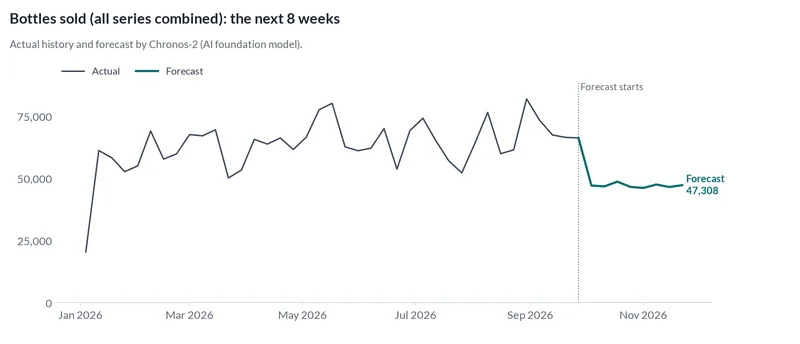
Wholesale orders for 500 store-product pairs
Iowa's public liquor sales: 8-week forecasts for the 500 biggest store-product pairs. Many items sell in bursts, so the result was flagged for review.
Iowa, United States · 64.6% error · 25% better than repeating last season