How much to reorder: fresh food demand forecast and reorder plan for 100 store-product pairs
We forecast daily units sold (normalized) for each of 100 store-product pairs 7 days ahead from a public dataset. In testing on past data, the selected method (the AI forecasting model with extra inputs) was off by 13% of actual volume on average, 13% less error than repeating the same weekday last week. On data the plan never saw, the recommended plan cost $102 (0.2%) less than ordering the forecast plus 15%, using example costs.
Read this first
- The costs and limits in the plan (unit cost, shortage cost, holding cost, waste cost, shelf life, lead time, pack size, moq, shelf capacity, budget) are example values chosen to show the method. With your business, we use your numbers.
The request
"Forecast daily demand for each store-and-product for the next 7 days (counting sales we lost when shelves were empty) and tell me how much to reorder so we stop running out without throwing food away."
The forecast
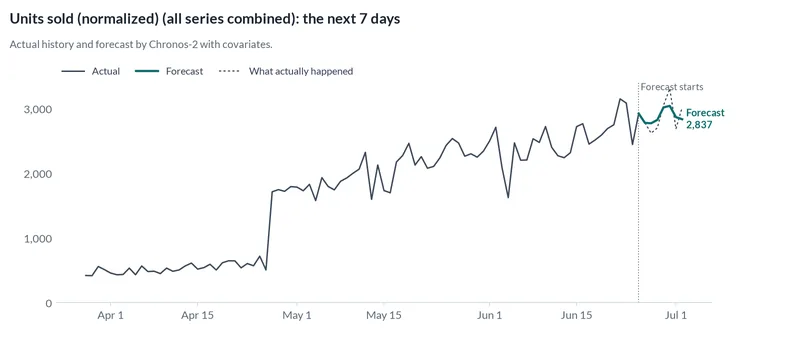
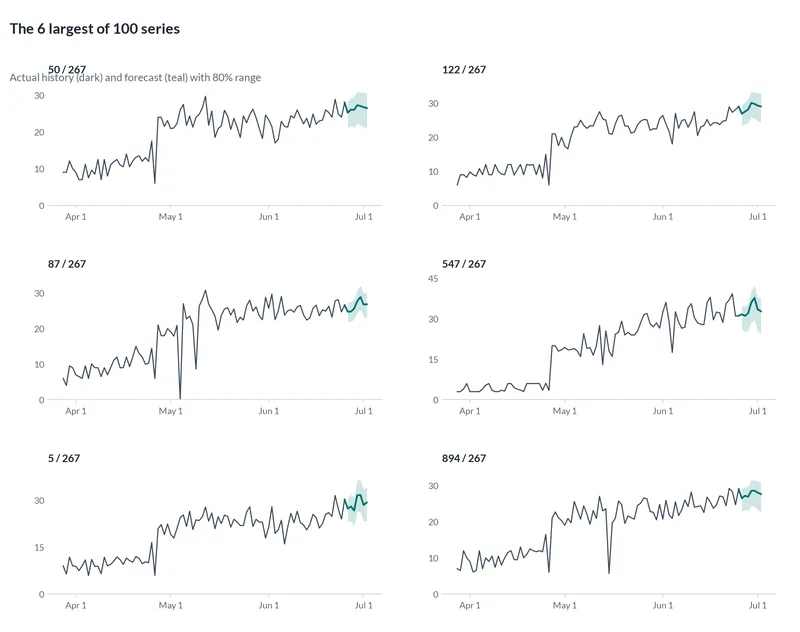
We expect about 20,152 units sold (normalized) over the next 7 days across all 100 series, about 2,879 per day on average.
How accurate was it?
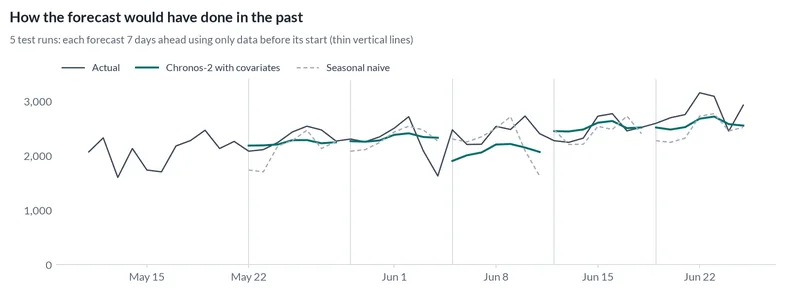
We hid the most recent stretch of history, forecast it using only what came before, and compared with what really happened. We did that 5 times, each time 7 days ahead, for every method below. The typical error is the share of actual volume the forecast missed by, added up across all 100 store-product pairs.
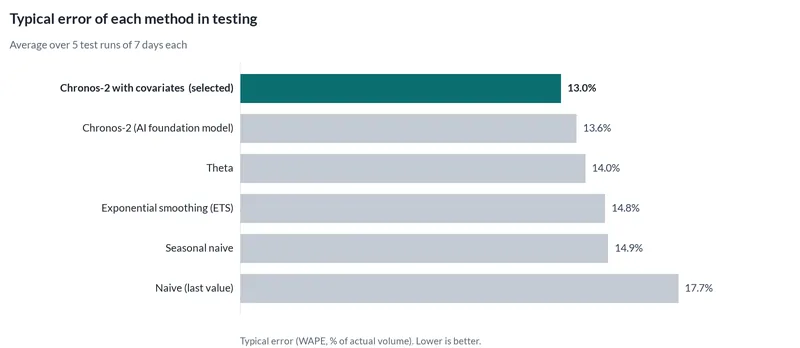
The selected method, the AI forecasting model, also given discounts, holidays, rainfall and temperature as extra inputs, was off by 13% on average, against 14.9% for simply repeating the same weekday last week.
| Method | Kind | Typical error | Actual inside 80% range |
|---|---|---|---|
| AI model with extra inputs Selected | AI | 13% | 80% |
| AI forecasting model | AI | 13.6% | 79% |
| Theta method | Classic | 14% | 81% |
| Exponential smoothing | Classic | 14.8% | 85% |
| Repeat last season | Simple rule | 14.9% | 88% |
| Repeat the last value | Simple rule | 17.7% | 87% |
Reality check on data no model saw
Before running anything, we set aside the final 700 days of the data (from 2024-06-25). Nothing in the testing above or the method choice could see them. Here is how every method did on that stretch.
On this stretch a simpler method did better: theta method had 10.4% error against 11.2% for the method we selected. Single periods are noisy, which is why we select on repeated tests, but we show it.
| Method | Typical error |
|---|---|
| Theta method | 10.4% |
| AI forecasting model | 11.2% |
| Exponential smoothing | 11.2% |
| AI model with extra inputs Selected | 11.2% |
| Repeat last season | 11.7% |
| Repeat the last value | 12.2% |
The plan
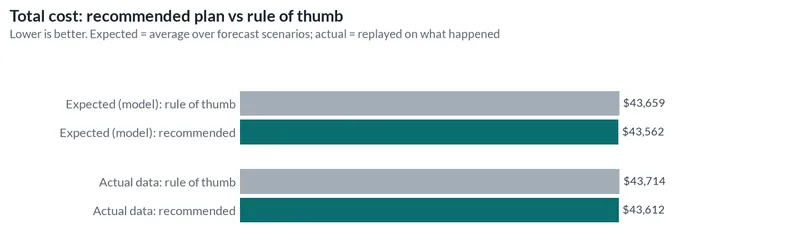
Recommended: order 19,464 units across 100 store-product pairs in 700 orders over the next 7 days. Expected total cost $43,562, 0.2% less than ordering the forecast plus 15%.
Why this plan: it balances the cost of running short ($3.50 per unit) against holding stock ($0.05 per unit per day), waste after the shelf life, within the cash budget.
Expected outcome: 94.4% of demand served, 260 units wasted, versus 94.5% served and 245 wasted with the rule of thumb.
Reality check: this plan was made as of Jun 25, 2024 without seeing later data. Replayed on what actually happened, it cost $43,612 against $43,714 for the rule of thumb: a measured saving of $102 (0.2%).
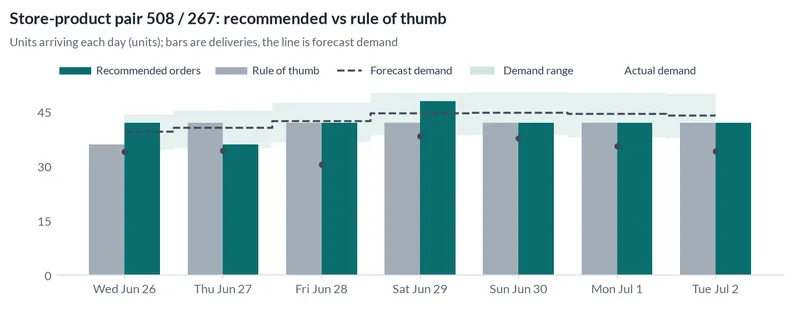
Plan against the rule of thumb
The rule of thumb here is ordering the forecast plus 15%. We compare both ways: the expected cost over many possible futures from the forecast, and a replay of both plans on what actually happened.
| Comparison | Saved by the plan | Percent |
|---|---|---|
| Expected, over forecast scenarios | $98 | 0.2% |
| Replayed on what actually happened | $102 | 0.2% |
| Input | Value | Where it came from |
|---|---|---|
| Unit cost | 2 ($/unit) | Example value |
| Shortage cost | 3.5 ($/unit) | Example value |
| Holding cost | 0.05 ($/unit/day) | Example value |
| Waste cost | 0.25 ($/unit) | Example value |
| Shelf life | 2 (days) | Example value |
| Lead time | 1 (days) | Example value |
| Pack size | 6 (units) | Example value |
| Moq | 2 (packs) | Example value |
| Shelf capacity | 90 (units) | Example value |
| Budget | 6,000 ($/day) | Example value |
What the engine noticed in the data
- Forecast made as of Jun 25, 2024: 2,100 later rows were hidden from the models and used afterwards to check the forecast.
- Ignored column 'activity_flag': it is constant, so it would not be known in advance.
- The level of the data changed recently (639 / 589: recent level is 1.7x the level before 2024-06-08). Older history may be less relevant.
Technical details
- Data
- FreshRetailNet-50K (Dingdong Inc.), China. 100 store-product pairs, daily, from 2024-03-28 to 2024-06-25.
- How we prepared the data
- Out of 50,000 store-and-product series, the engine keeps the 100 with the highest sales. The official evaluation week (Jun 26 to Jul 2, 2024) is hidden with as_of and used as the reality check. Discounts, holidays and promotions in that week are treated as known in advance (they are planned). Sales are normalized by the publisher (not real units), and stock-outs censor demand; v1 forecasts observed sales, not lost demand. The reorder plan treats forecast sales as demand, so it inherits that censoring; costs, pack sizes, shelf space and the daily budget are example values.
- Testing
- 5 rolling tests, each 7 days ahead. Selection metric: WAPE (weighted absolute percentage error, the "typical error" above). Also reported: MASE 0.93 for the selected method.
- Methods
- Chronos-2 with covariates, Chronos-2 (AI foundation model), Theta, Exponential smoothing (ETS), Seasonal naive, Naive (last value).
- Plan
- Daily reorder plan for the top 100 store-product pairs. Optimization status: ok, solver: optimal.
- Reproduce
- The case folder, spec and outputs are in the 4castPlannr repository under
cases/freshretailnet-50k/.
Data source and license
Wang, Y. et al. (2025). FreshRetailNet-50K: A Stockout-Annotated Censored Demand Dataset for Latent Demand Recovery and Forecasting in Fresh Retail. arXiv:2505.16319. Data by Dingdong-Inc, CC BY 4.0.
License: CC BY 4.0. Source: original data. The forecasts and charts on this page are derived from that data and carry the same attribution.
Have a decision like this?
This case is an example of inventory reorder for wholesale distributors. Send us your own export and question, and we will run the same tests on your data.
Related case studies
-
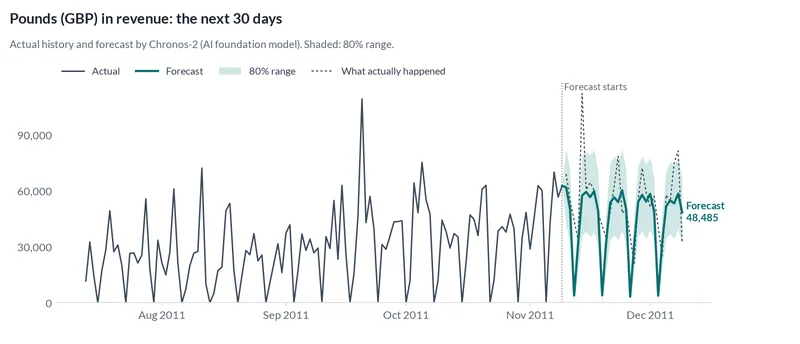
Online store revenue
A public UK online retailer's order lines turned into a 30-day daily revenue forecast for the Christmas peak, checked against what actually happened.
United Kingdom · 31.4% error · 20% better than repeating last season
-
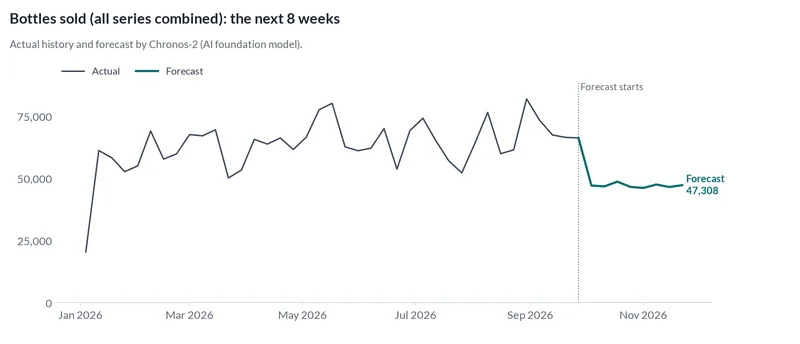
Wholesale orders for 500 store-product pairs
Iowa's public liquor sales: 8-week forecasts for the 500 biggest store-product pairs. Many items sell in bursts, so the result was flagged for review.
Iowa, United States · 64.6% error · 25% better than repeating last season