Forecasting from a messy monthly file: three date styles, gaps and corrections
We forecast monthly passengers for each of 10 airlines 12 months ahead from a public dataset. In testing on past data, the selected method (the AI forecasting model) was off by 12.1% of actual volume on average, 36% less error than repeating the same month last year.
Read this first
- This file was deliberately broken the way real exports break, to test that the engine cleans it without help.
The request
"Monthly passengers per airline for the next 12 months please. Data attached."
The forecast
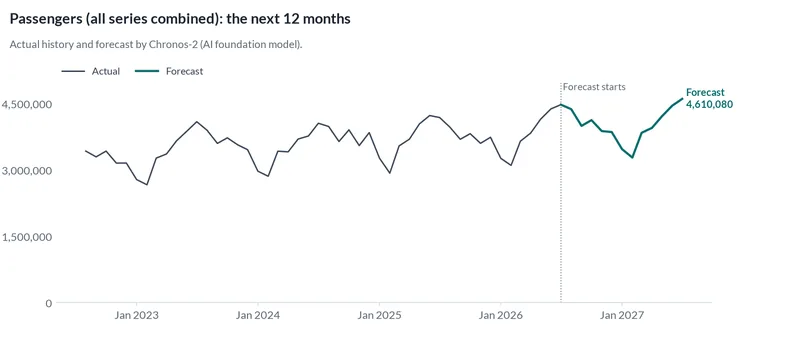
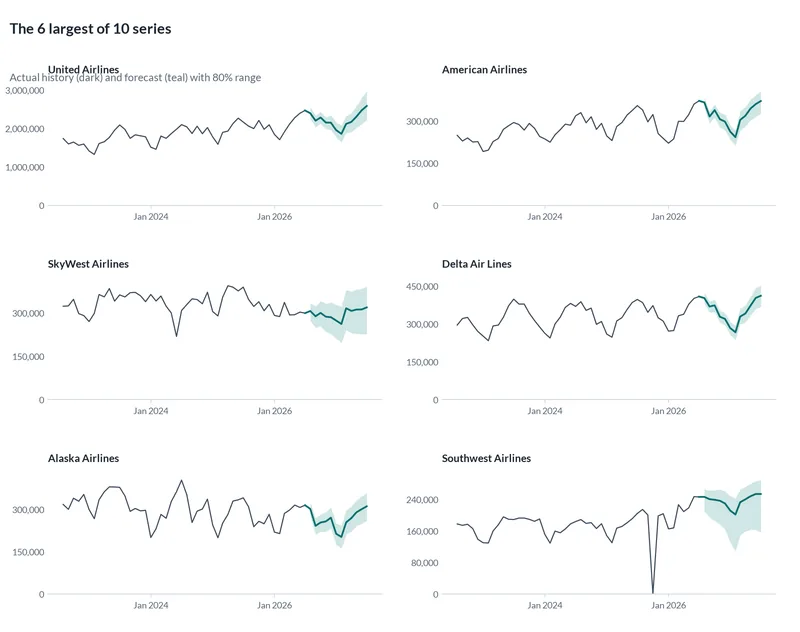
We expect about 48.1 million passengers over the next 12 months across all 10 series, about 4,006,700 per month on average.
How accurate was it?
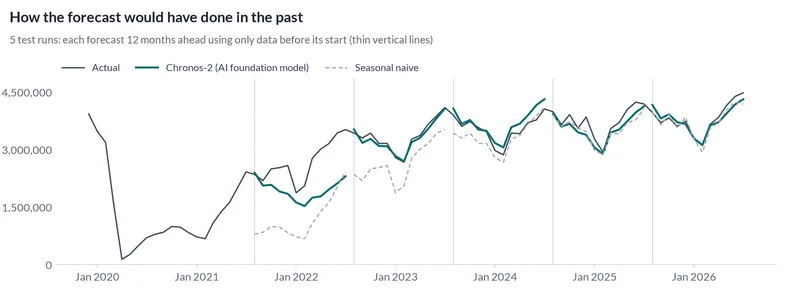
We hid the most recent stretch of history, forecast it using only what came before, and compared with what really happened. We did that 5 times, each time 12 months ahead, for every method below. The typical error is the share of actual volume the forecast missed by, added up across all 10 airlines.
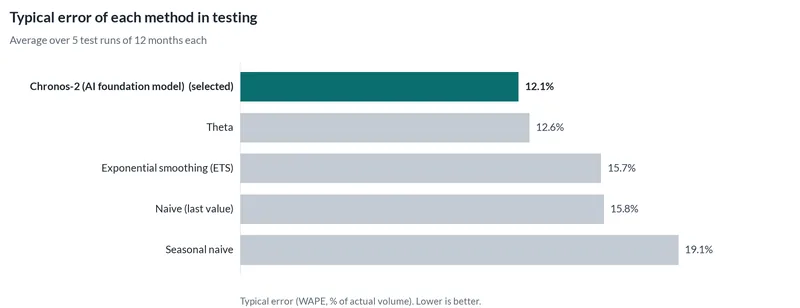
The selected method, an AI forecasting model that was not trained on this data, was off by 12.1% on average, against 19.1% for simply repeating the same month last year.
| Method | Kind | Typical error | Actual inside 80% range |
|---|---|---|---|
| AI forecasting model Selected | AI | 12.1% | 78% |
| Theta method | Classic | 12.6% | 89% |
| Exponential smoothing | Classic | 15.7% | 82% |
| Repeat the last value | Simple rule | 15.8% | 83% |
| Repeat last season | Simple rule | 19.1% | 76% |
What the engine noticed in the data
- Dates were written in 3 different formats; all were converted.
- 197 rows have a negative value (for example returns or refunds). They were netted against the other rows in the same period.
- Removed 775 exact duplicate rows (identical down to 'Passenger Count', which is almost never repeated by chance).
- 101 months with no rows were filled by interpolation, because passengers is otherwise never close to zero (more likely missing data than a closed business). If you were closed on those months, tell us and we will treat them as zero.
Technical details
- Data
- SFO Air Traffic Passenger Statistics (San Francisco International Airport via DataSF). 10 airlines, monthly, from 1999-07-01 to 2026-07-01.
- How we prepared the data
- Intentionally dirtied copy of sfo-air-traffic-passengers. What was broken on purpose: Month written three ways (Jul-2019, 2019-07, 201907); 3% of airline-months removed; 2% of rows duplicated; 0.5% extra rows with negative 'corrections'; rows shuffled. The spec is the same kind of spec a clean file would get: no per-case cleaning code.
- Testing
- 5 rolling tests, each 12 months ahead. Selection metric: WAPE (weighted absolute percentage error, the "typical error" above). Also reported: MASE 0.98 for the selected method.
- Methods
- Chronos-2 (AI foundation model), Theta, Exponential smoothing (ETS), Naive (last value), Seasonal naive.
- Reproduce
- The case folder, spec and outputs are in the 4castPlannr repository under
cases/sfo-air-traffic-passengers-dirty/.
Data source and license
Source: San Francisco International Airport, Air Traffic Passenger Statistics, DataSF (data.sf.gov), ODC PDDL.
License: ODC Public Domain Dedication and License (PDDL) 1.0. Source: original data. The forecasts and charts on this page are derived from that data and carry the same attribution.
Have a decision like this?
This case is an example of staffing plans for call centers and service businesses. Send us your own export and question, and we will run the same tests on your data.
Related case studies
-
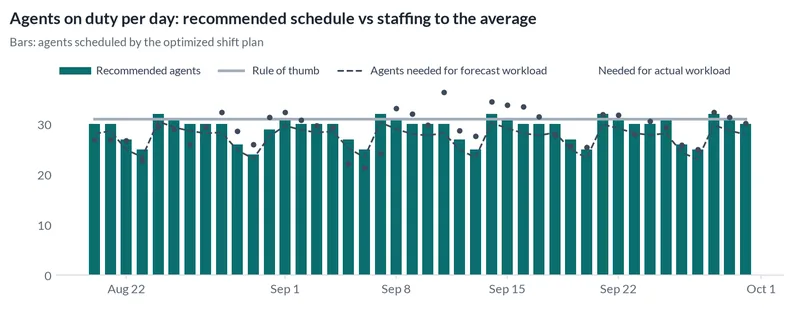
Contact center staffing plan
San Francisco 311 public data: daily phone, web and app requests forecast six weeks ahead, and an agent shift plan replayed on the weeks that followed.
San Francisco, United States · 9.8% error · 27% better than repeating last season
-
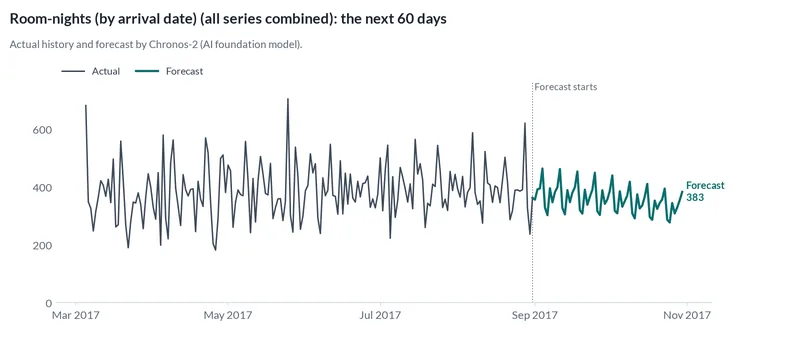
Hotel room-nights
A public dataset from two hotels: daily room-nights forecast 60 days ahead per hotel, with the accuracy we measured in testing.
Portugal · 29.6% error · 37% better than repeating last season
-
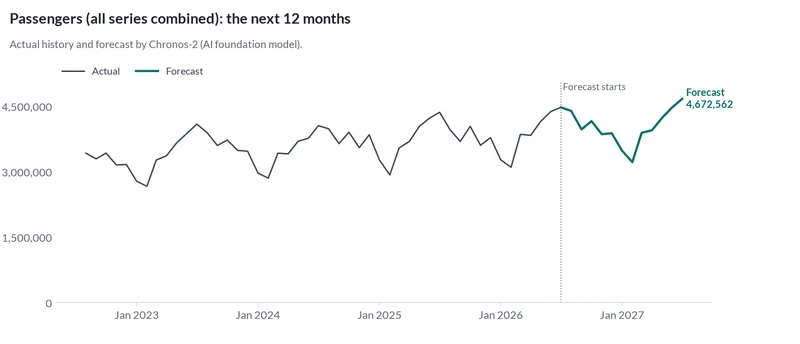
Airport passengers by airline
San Francisco International Airport's public statistics: monthly passengers for the 10 largest airlines forecast a year ahead.
San Francisco, United States · 11.8% error · 38% better than repeating last season