Restaurant sales forecast and ingredient order plan from a POS export
We forecast daily pizzas sold 14 days ahead from a synthetic public dataset. In testing on past data, the selected method (exponential smoothing) was off by 11.9% of actual volume on average, 23% less error than repeating the same weekday last week. On data the plan never saw, the recommended plan cost $494 (9.7%) more than ordering the forecast plus 20%, using example costs.
Read this first
- This dataset is synthetic: it was generated to look like a year of sales at a US pizza place. It is not a real business.
- The costs and limits in the plan (bom, lost margin per unit, unit cost, holding cost, waste cost, shelf life, pack size, lead time, delivery days, initial inventory) are example values chosen to show the method. With your business, we use your numbers.
The request
"Forecast how many pizzas (and orders) we'll sell each day and each hour for the next 14 days, by pizza type, so I can plan dough prep and how many people to put on each shift."
The forecast
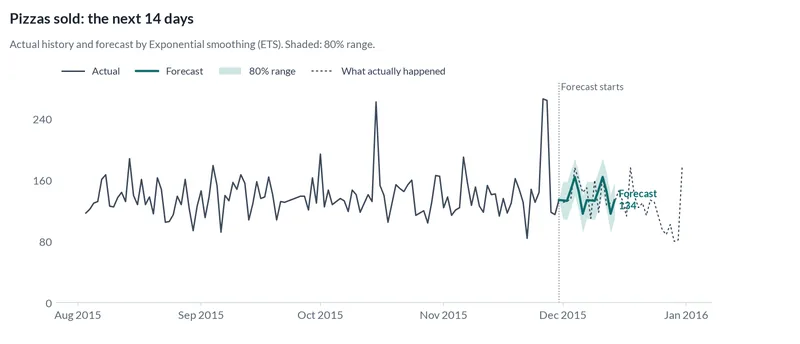
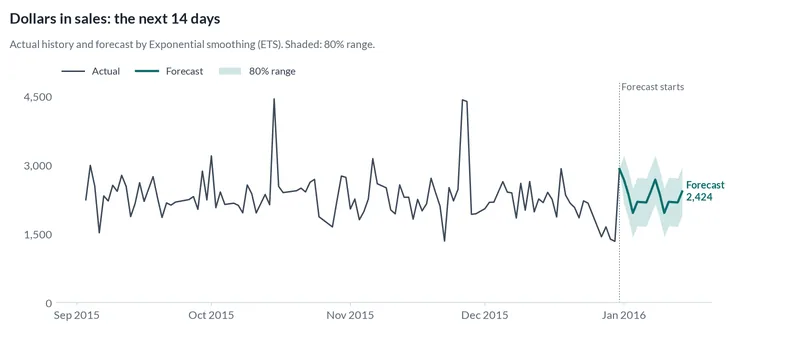
We expect about 1,946 pizzas sold over the next 14 days, about 139 per day on average.
How accurate was it?
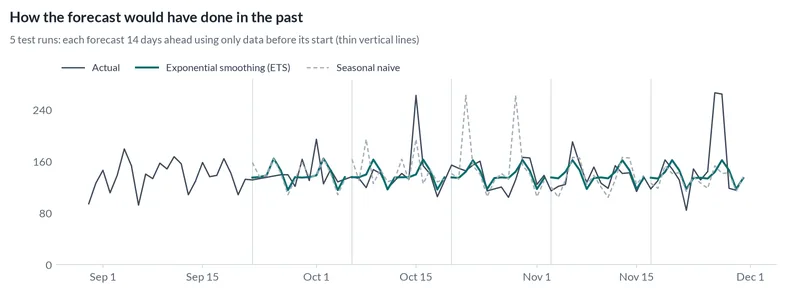
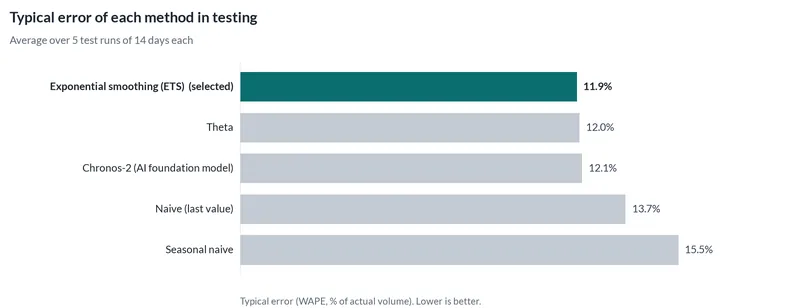
We hid the most recent stretch of history, forecast it using only what came before, and compared with what really happened. We did that 5 times, each time 14 days ahead, for every method below. The typical error is the share of actual volume the forecast missed by.
The selected method, exponential smoothing, a classic statistical method, was off by 11.9% on average, against 15.5% for simply repeating the same weekday last week.
| Method | Kind | Typical error | Actual inside 80% range |
|---|---|---|---|
| Exponential smoothing Selected | Classic | 11.9% | 83% |
| Theta method | Classic | 12% | 87% |
| AI forecasting model | AI | 12.1% | 76% |
| Repeat the last value | Simple rule | 13.7% | 97% |
| Repeat last season | Simple rule | 15.5% | 89% |
Reality check on data no model saw
Before running anything, we set aside the final 14 days of the data (from 2015-11-30). Nothing in the testing above or the method choice could see them. Here is how every method did on that stretch.
Another version of the AI model did slightly better on this stretch (10.1% against 10.2%).
| Method | Typical error |
|---|---|
| AI forecasting model | 10.1% |
| Exponential smoothing Selected | 10.2% |
| Repeat the last value | 10.7% |
| Theta method | 11% |
| Repeat last season | 31.9% |
The plan
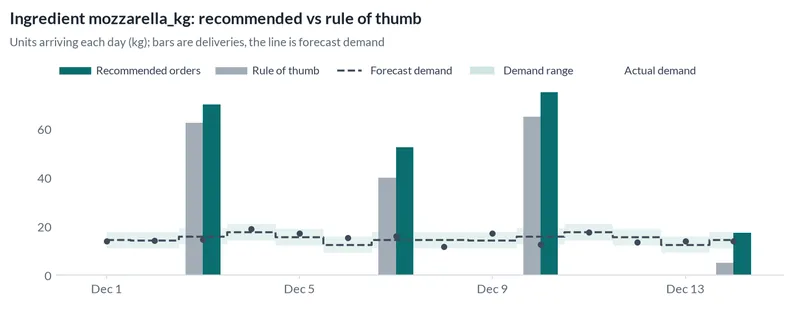
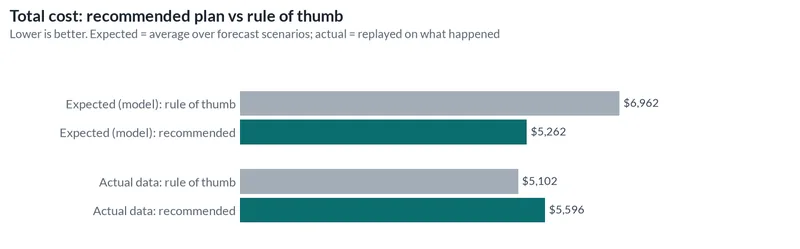
Recommended: order 510 kg of dough, 215 kg of mozzarella, 177 kg of tomato sauce, 2,050 units of boxes in 16 orders over the next 14 days. Expected total cost $5,262, 24% less than ordering the forecast plus 20%.
Why this plan: it balances the cost of running short ($9 of margin per pizza that cannot be made) against holding stock ($0.01 per unit per day), waste after the shelf life, with deliveries only on Mondays and Thursdays.
Expected outcome: 97.6% of demand served, 109 units wasted, versus 94.9% served and 109 wasted with the rule of thumb.
Reality check: replayed on what actually happened after Nov 30, 2015, the rule of thumb did better this time ($5,102 against $5,596, 10% cheaper). Across the forecast scenarios the plan is still the better bet on average, but this period did not show it.
Stock left over at the end of the period (still within shelf life, at cost) is worth $513 under the plan and $35 under the rule of thumb. These comparisons count it as spent; in practice most of it carries into the next period.
Plan against the rule of thumb
The rule of thumb here is ordering the forecast plus 20%. We compare both ways: the expected cost over many possible futures from the forecast, and a replay of both plans on what actually happened.
| Comparison | Saved by the plan | Percent |
|---|---|---|
| Expected, over forecast scenarios | $1,700 | 24.4% |
| Replayed on what actually happened | -$494 | -9.7% |
The rule of thumb won this one
On the held-back data, ordering the forecast plus 20% cost $494 less than our plan, even though the plan expected to save money across the forecast scenarios. One short replay does not settle it either way, but we do not hide it. With a real business we would check the costs, especially the cost of running short, with you before relying on the plan; here both the costs and the data are examples.
| Input | Value | Where it came from |
|---|---|---|
| Bom | dough S 0.2, M 0.27, L 0.35, XL 0.45, XXL 0.55, mozzarella S 0.07, M 0.1, L 0.14, XL 0.18, XXL 0.22, tomato sauce S 0.06, M 0.08, L... (quantity per pizza) | Example value |
| Mix column | size | From the data |
| Mix window | 28 (days) | Assumed |
| Lost margin per unit | 9 ($/pizza) | Example value |
| Unit cost | dough 1.1, mozzarella 6.5, tomato sauce 2.2, boxes 0.35 ($/unit) | Example value |
| Holding cost | dough 0.02, mozzarella 0.05, tomato sauce 0.01, boxes 0.001 ($/unit/day) | Example value |
| Waste cost | 0.1 ($/unit) | Example value |
| Shelf life | dough 3, mozzarella 14, tomato sauce 30, boxes 365 (days) | Example value |
| Pack size | dough 10, mozzarella 2.5, tomato sauce 3, boxes 50 (units) | Example value |
| Lead time | 2 (days) | Example value |
| Delivery days | monday, thursday (weekdays) | Example value |
| Initial inventory | dough 95, mozzarella 40, tomato sauce 30, boxes 300 (units) | Example value |
What the engine noticed in the data
- Forecast made as of Nov 30, 2015: 3,935 later rows were hidden from the models and used afterwards to check the forecast.
- 6 days with no rows were filled by interpolation, because pizzas sold is otherwise never close to zero (more likely missing data than a closed business). If you were closed on those days, tell us and we will treat them as zero.
Technical details
- Data
- Pizza Place Sales (gt::pizzaplace), United States (synthetic). 1 series, daily, from 2015-01-01 to 2015-11-30.
- How we prepared the data
- Daily total pizzas for the whole store (one row in the file = one pizza). The request also mentions hourly and per-type forecasts; v1 runs one target per job, so this case covers the daily store total. Two weeks (Dec 1 to Dec 14, 2015) are hidden with as_of and used to replay the ingredient plan. The size mix comes from the data (last 28 days); recipes, prices, pack sizes, delivery days and starting stock are example values.
- Testing
- 5 rolling tests, each 14 days ahead. Selection metric: WAPE (weighted absolute percentage error, the "typical error" above). Also reported: MASE 0.92 for the selected method.
- Methods
- Exponential smoothing (ETS), Theta, Chronos-2 (AI foundation model), Naive (last value), Seasonal naive.
- Plan
- Two-week ingredient order plan from the pizza forecast. Optimization status: ok, solver: optimal.
- Reproduce
- The case folder, spec and outputs are in the 4castPlannr repository under
cases/pizza-place-sales/.
Data source and license
pizzaplace dataset from the gt R package, Copyright (c) 2018-2026 Posit Software, PBC, MIT License.
License: MIT (gt R package by Posit; data is part of the package). Source: original data. The forecasts and charts on this page are derived from that data and carry the same attribution.
Have a decision like this?
This case is an example of restaurant demand for restaurants and food service. Send us your own export and question, and we will run the same tests on your data.
Related case studies
-
Messy POS export
The pizza dataset deliberately broken the way real exports break: four date formats, semicolons, missing days, double scans and refunds. Same engine, no hand cleaning.
United States (synthetic) · 15% error · 23% better than repeating last season · synthetic data · messy file test