Forecasting from a messy POS export: mixed dates, duplicates and refunds
We forecast daily dollars in sales 14 days ahead from a synthetic public dataset. In testing on past data, the selected method (exponential smoothing) was off by 15% of actual volume on average, 23% less error than repeating the same weekday last week.
Read this first
- This dataset is synthetic: it was generated to look like a year of sales at a US pizza place. It is not a real business.
- This file was deliberately broken the way real exports break, to test that the engine cleans it without help.
The request
"Here's our POS export. Forecast daily sales in dollars for the next two weeks."
The forecast
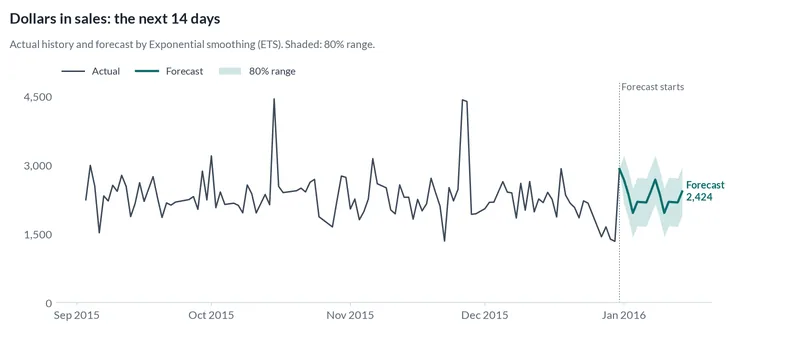
We expect about 32,014 dollars in sales over the next 14 days, about 2,287 per day on average.
How accurate was it?
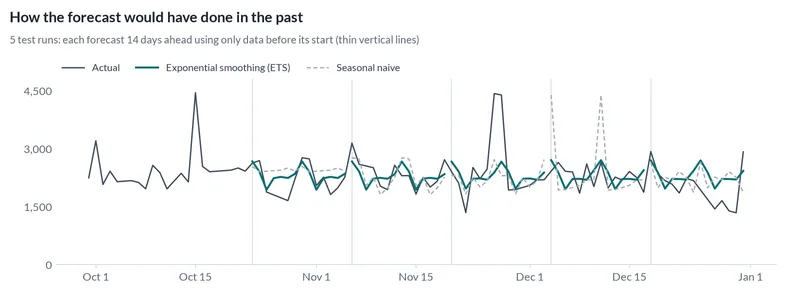
We hid the most recent stretch of history, forecast it using only what came before, and compared with what really happened. We did that 5 times, each time 14 days ahead, for every method below. The typical error is the share of actual volume the forecast missed by.
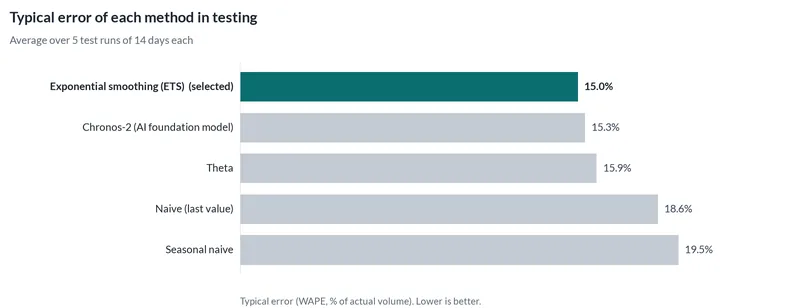
The selected method, exponential smoothing, a classic statistical method, was off by 15% on average, against 19.5% for simply repeating the same weekday last week.
| Method | Kind | Typical error | Actual inside 80% range |
|---|---|---|---|
| Exponential smoothing Selected | Classic | 15% | 74% |
| AI forecasting model | AI | 15.3% | 60% |
| Theta method | Classic | 15.9% | 79% |
| Repeat the last value | Simple rule | 18.6% | 94% |
| Repeat last season | Simple rule | 19.5% | 84% |
What the engine noticed in the data
- Dates were written in 4 different formats; all were converted.
- 478 rows have a negative value (for example returns or refunds). They were netted against the other rows in the same period.
- Removed 256 exact duplicate rows (column 'rownames' should be unique).
- 24 days with no rows were filled by interpolation, because dollars in sales is otherwise never close to zero (more likely missing data than a closed business). If you were closed on those days, tell us and we will treat them as zero.
- 24 days (6.6%) had no data and were filled as described above.
Technical details
- Data
- Pizza Place Sales (gt::pizzaplace), United States (synthetic). 1 series, daily, from 2015-01-01 to 2015-12-31.
- How we prepared the data
- Intentionally dirtied copy of pizza-place-sales. What was broken on purpose: Semicolon separators and decimal commas; four different date formats mixed row by row (2015-01-01, 01/01/2015, 01 Jan 2015, Jan 01 2015); 5% of trading days missing; about 2% of lines duplicated exactly (double scans); about 1% refunds as negative-price lines. The spec is the same kind of spec a clean file would get: no per-case cleaning code.
- Testing
- 5 rolling tests, each 14 days ahead. Selection metric: WAPE (weighted absolute percentage error, the "typical error" above). Also reported: MASE 1.06 for the selected method.
- Methods
- Exponential smoothing (ETS), Chronos-2 (AI foundation model), Theta, Naive (last value), Seasonal naive.
- Reproduce
- The case folder, spec and outputs are in the 4castPlannr repository under
cases/pizza-place-sales-dirty/.
Data source and license
pizzaplace dataset from the gt R package, Copyright (c) 2018-2026 Posit Software, PBC, MIT License.
License: MIT (gt R package by Posit; data is part of the package). Source: original data. The forecasts and charts on this page are derived from that data and carry the same attribution.
Have a decision like this?
This case is an example of restaurant demand for restaurants and food service. Send us your own export and question, and we will run the same tests on your data.
Related case studies
-
Pizza shop ingredient orders
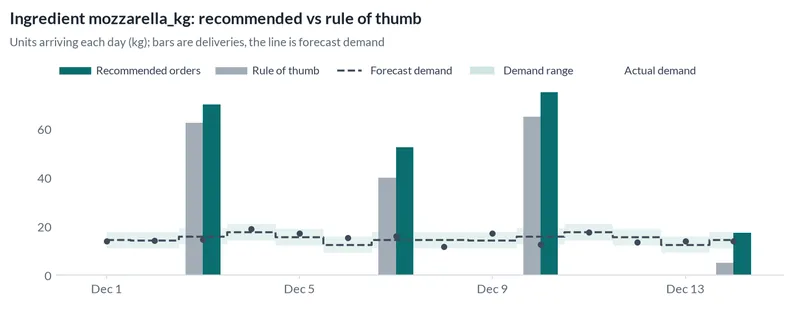
A synthetic pizza shop: a 14-day sales forecast and a two-week order plan for dough, cheese, sauce and boxes. The rule of thumb won the reality check.
United States (synthetic) · 11.9% error · 23% better than repeating last season · synthetic data