Production planning for a yogurt maker: 28-day forecast and line schedule
We forecast daily units sold for each of 6 products 28 days ahead from a public dataset. In testing on past data, the selected method (the AI forecasting model with extra inputs) was off by 19.3% of actual volume on average, 28% less error than repeating the same weekday last week. On data the plan never saw, the recommended plan cost $21,369 (9.5%) less than producing the forecast plus 10%, using example costs.
Read this first
- The costs and limits in the plan (unit cost, shortage cost, holding cost, waste cost, shelf life, pack size, setup cost, setup time, resource per unit, capacity, initial inventory) are example values chosen to show the method. With your business, we use your numbers.
The request
"Forecast daily unit sales for each of our 7 yogurt products for the next 28 days so we can schedule production runs and cut product that gets returned."
The forecast
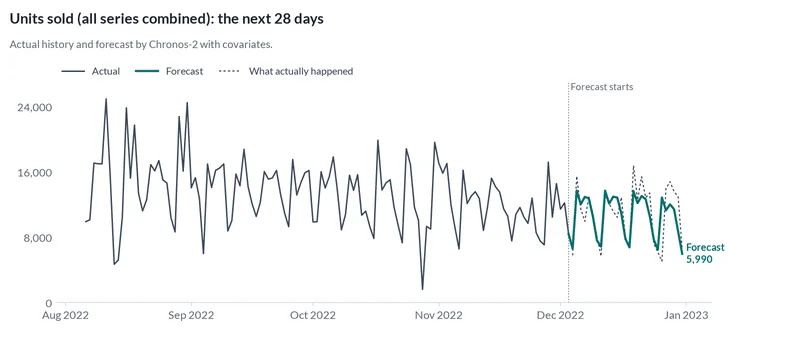
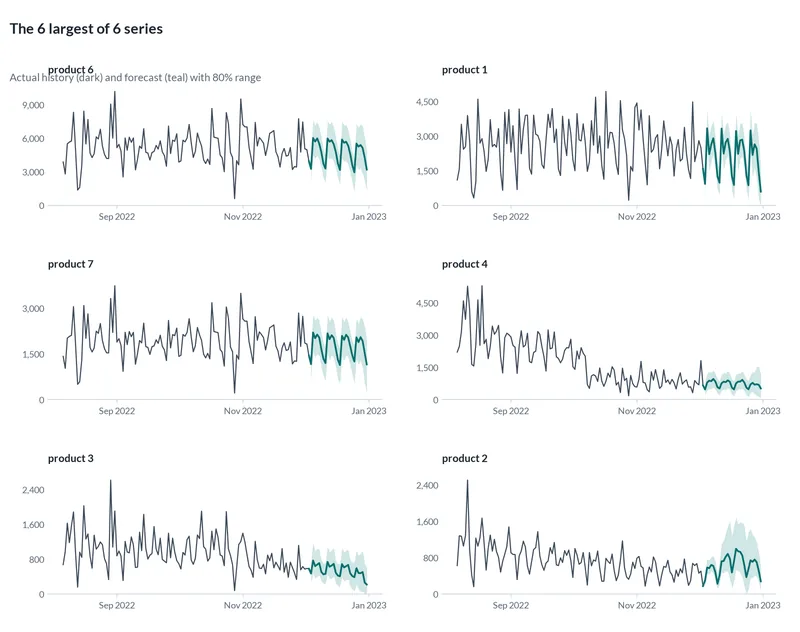
We expect about 299,208 units sold over the next 28 days across all 6 series, about 10,686 per day on average.
How accurate was it?
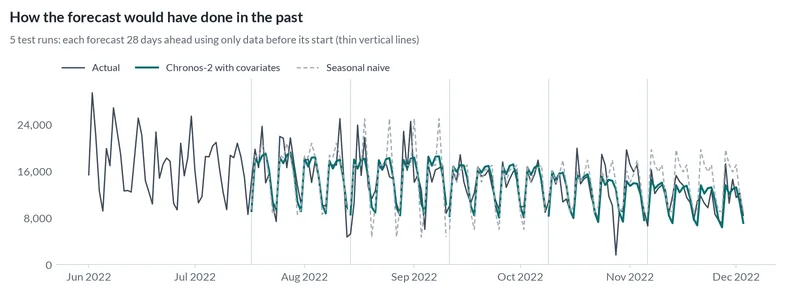
We hid the most recent stretch of history, forecast it using only what came before, and compared with what really happened. We did that 5 times, each time 28 days ahead, for every method below. The typical error is the share of actual volume the forecast missed by, added up across all 6 products.
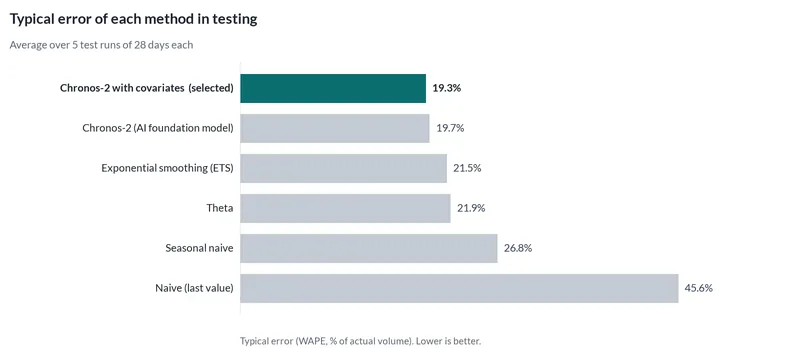
The selected method, the AI forecasting model, also given the number of stores carrying each product as an extra input, was off by 19.3% on average, against 26.8% for simply repeating the same weekday last week.
| Method | Kind | Typical error | Actual inside 80% range |
|---|---|---|---|
| AI model with extra inputs Selected | AI | 19.3% | 80% |
| AI forecasting model | AI | 19.7% | 82% |
| Exponential smoothing | Classic | 21.5% | 81% |
| Theta method | Classic | 21.9% | 88% |
| Repeat last season | Simple rule | 26.8% | 90% |
| Repeat the last value | Simple rule | 45.6% | 97% |
Reality check on data no model saw
Before running anything, we set aside the final 167 days of the data (from 2022-12-03). Nothing in the testing above or the method choice could see them. Here is how every method did on that stretch.
Another version of the AI model did slightly better on this stretch (22.7% against 23%).
| Method | Typical error |
|---|---|
| AI forecasting model | 22.7% |
| AI model with extra inputs Selected | 23% |
| Exponential smoothing | 23.2% |
| Theta method | 24.8% |
| Repeat last season | 27.1% |
| Repeat the last value | 38.7% |
The plan
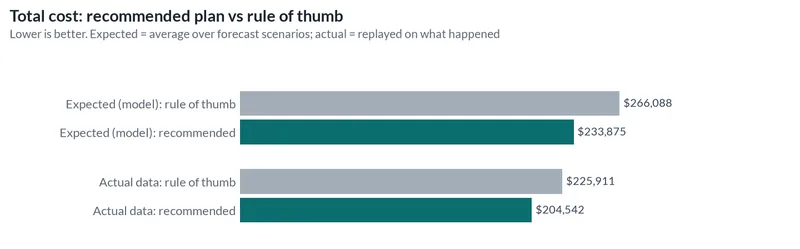
Recommended: produce 58,100 units of product 1, 21,100 units of product 2, 17,700 units of product 3, 23,700 units of product 4, 140,400 units of product 6, 44,400 units of product 7 in 38 production runs over the next 28 days. Expected total cost $233,875, 12% less than producing the forecast plus 10%.
Why this plan: it balances the cost of running short ($2 per unit) against holding stock ($0.01 per unit per day), waste after the shelf life, and fixed costs per run, within the shared capacity.
Expected outcome: 91.5% of demand served, 31,438 units wasted, versus 86.9% served and 3,561 wasted with the rule of thumb.
Reality check: this plan was made as of Dec 03, 2022 without seeing later data. Replayed on what actually happened, it cost $204,542 against $225,911 for the rule of thumb: a measured saving of $21,369 (9.5%).
Stock left over at the end of the period (still within shelf life, at cost) is worth $8,925 under the plan and $400 under the rule of thumb. These comparisons count it as spent; in practice most of it carries into the next period.
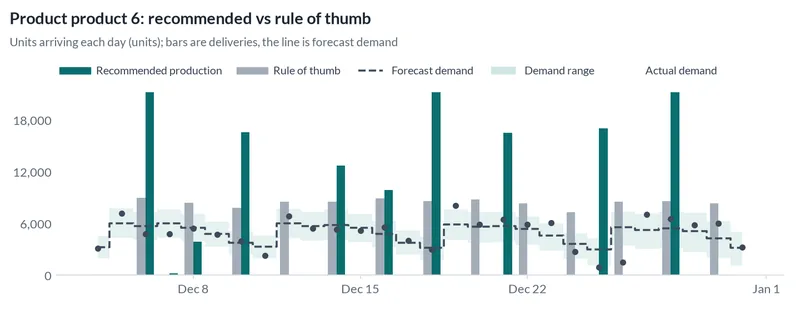
Plan against the rule of thumb
The rule of thumb here is producing the forecast plus 10%. We compare both ways: the expected cost over many possible futures from the forecast, and a replay of both plans on what actually happened.
| Comparison | Saved by the plan | Percent |
|---|---|---|
| Expected, over forecast scenarios | $32,212 | 12.1% |
| Replayed on what actually happened | $21,369 | 9.5% |
| Input | Value | Where it came from |
|---|---|---|
| Unit cost | 0.45 ($/unit) | Example value |
| Shortage cost | 2 ($/unit) | Example value |
| Holding cost | 0.01 ($/unit/day) | Example value |
| Waste cost | 0.05 ($/unit) | Example value |
| Shelf life | 10 (days) | Example value |
| Pack size | 100 (units) | Example value |
| Setup cost | 600 ($) | Example value |
| Setup time | 1.5 (hours/run) | Example value |
| Resource per unit | 0.0004 (hours/unit) | Example value |
| Capacity | 10 (hours/day) | Example value |
| Initial inventory | product 1 4,800, product 2 1,000, product 3 1,300, product 4 1,700, product 6 10,200, product 7 3,700 (units) | Example value |
What the engine noticed in the data
- Forecast made as of Dec 03, 2022: 167 later rows were hidden from the models and used afterwards to check the forecast.
- 18 rows have a negative value (for example returns or refunds). They were netted against the other rows in the same period.
- Skipped 1 series with no recent data: product 5.
- 15 days had a negative total after returns; set to zero.
Technical details
- Data
- Dairy Supply Chain Sales Dataset (MEVGAL, Greece - Zenodo / IEEE DataPort). 6 products, daily, from 2020-01-01 to 2022-12-03.
- How we prepared the data
- All 21 Excel files are read straight from the zip; the product comes from each file's folder name ('product 1' to 'product 7'). Points of distribution is used as a past-only input for Chronos-2 with covariates. The last 28 days of the data (Dec 4 to Dec 31, 2022) are hidden with as_of and used to replay the production plan. Line capacity, changeover cost, shelf life, costs and starting stock are example values.
- Testing
- 5 rolling tests, each 28 days ahead. Selection metric: WAPE (weighted absolute percentage error, the "typical error" above). Also reported: MASE 0.82 for the selected method.
- Methods
- Chronos-2 with covariates, Chronos-2 (AI foundation model), Exponential smoothing (ETS), Theta, Seasonal naive, Naive (last value).
- Plan
- Four-week production plan for the yogurt line. Optimization status: ok, solver: feasible.
- Reproduce
- The case folder, spec and outputs are in the 4castPlannr repository under
cases/dairy-supply-chain-sales/.
Data source and license
Iatropoulos, K., Georgakidis, K., Siniosoglou, I., et al. (2023). Dairy Supply Chain Sales Dataset [Dataset]. Zenodo / IEEE DataPort. https://doi.org/10.21227/smv6-z405. CC BY 4.0.
License: CC BY 4.0. Source: original data. The forecasts and charts on this page are derived from that data and carry the same attribution.
Have a decision like this?
This case is an example of production planning for food and beverage producers. Send us your own export and question, and we will run the same tests on your data.